
Foam and Nutrient Management: Feeding the Biology That Runs Your Plant
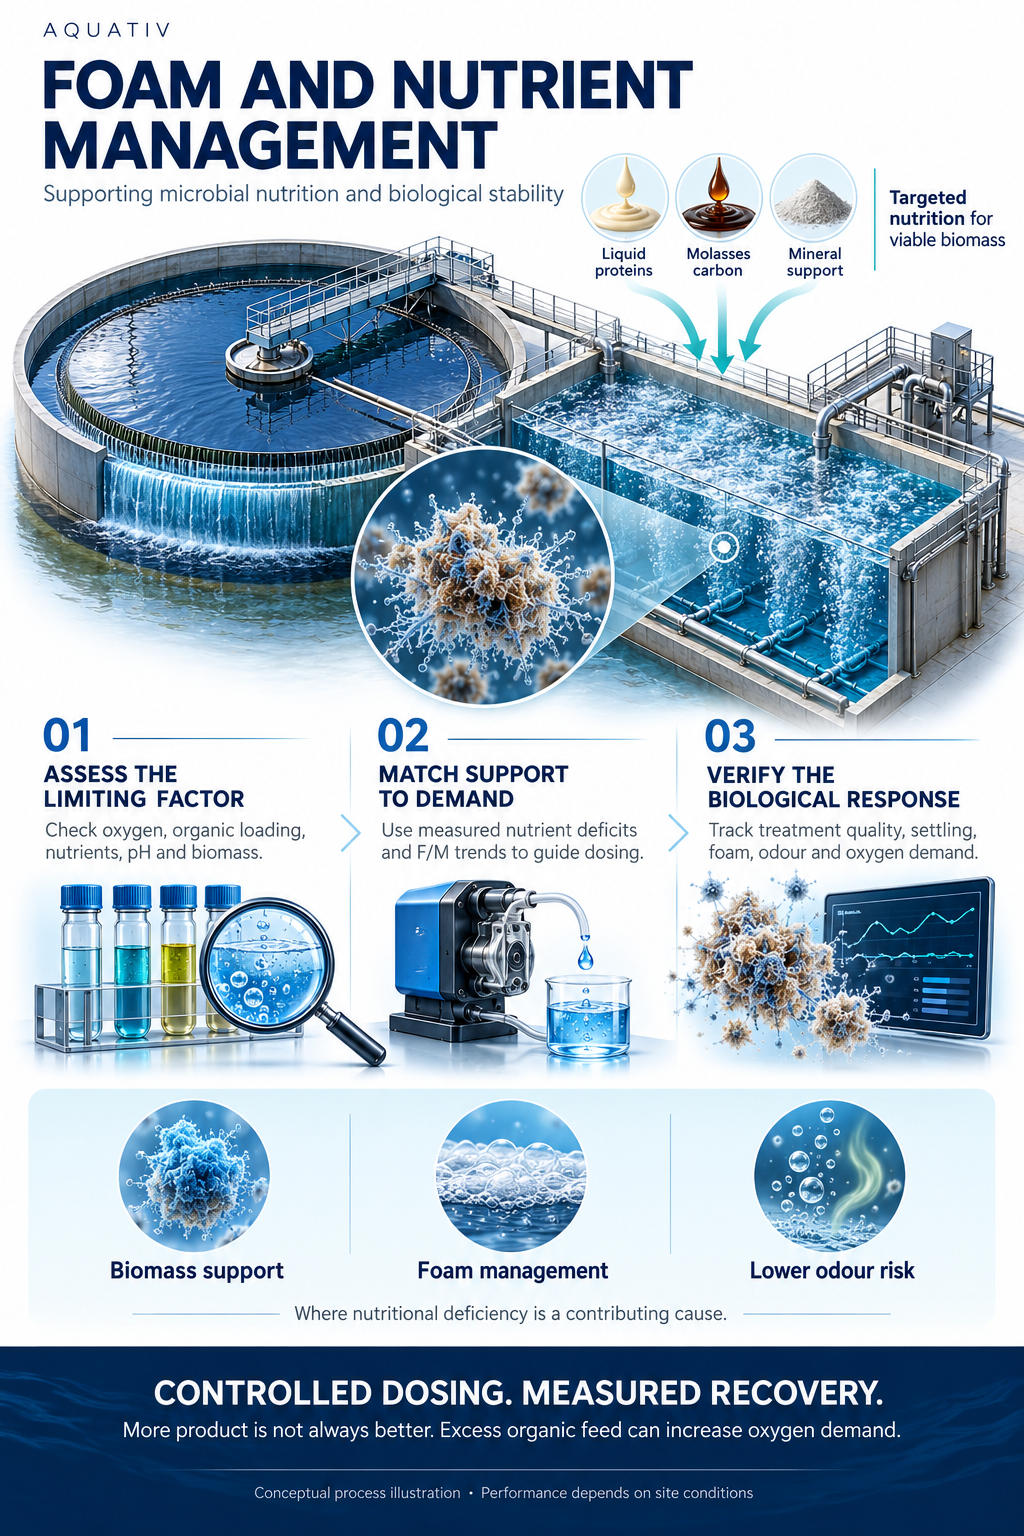
A biological wastewater plant is a living system. Its bacteria need usable carbon, the right nutrients, enough oxygen, mixing and retention time to turn incoming load into stable, settleable sludge. Foam and Nutrient Management supports the biology when a verified nutritional shortfall is limiting treatment. It works best when dosing follows measured demand, not guesswork.
Why a plant can have plenty of organic material and still struggle
The carbon may be difficult to break down, nitrogen or phosphorus may be in short supply, or the biomass may be stressed by something upstream. Symptoms can include foam, odour, poor settling and effluent drifting out of specification.
Aquativ's liquid nutrient support product combines readily biodegradable carbon from molasses, a protein source that releases organic carbon and nitrogen as it breaks down, and supporting minerals. Its role is to address a nutritional imbalance so the plant can recover its own stability, provided the other operating conditions support that recovery.
Why microbial nutrition matters
Heterotrophic bacteria in an aerobic plant convert biodegradable organic matter into new cells, carbon dioxide and water. They need energy from carbon, nitrogen, phosphorus and trace minerals to build cells and keep enzymes working. Growth is governed by whichever requirement runs out first.
Adding carbon alone cannot resolve a phosphorus deficiency. Adding nitrogen cannot correct a plant starved of oxygen. The goal is to remove the constraint actually holding the biology back without creating a new one.
Molasses supplies accessible carbon. The protein component breaks down more gradually, releasing carbon and nitrogen over time. Minerals support the enzyme systems involved in breakdown and floc formation. These inputs can support a stressed population only when oxygen and mixing are adequate.
Understanding the food-to-microorganism ratio
The food-to-microorganism ratio, or F/M, describes incoming organic load relative to the biomass available to treat it. For activated sludge, a common expression is F/M = (Q × S) ÷ (V × Xv).
Q is flow in cubic metres per day; S is influent BOD5 in kilograms per cubic metre; V is aeration volume in cubic metres; and Xv is mixed liquor volatile suspended solids (MLVSS) in kilograms per cubic metre. The result is kilograms of BOD5 per kilogram of MLVSS per day. Keep the basis consistent: do not compare a BOD-based F/M with a COD-based figure.
Illustrative example, not an operating target: 500 cubic metres per day at 400 mg/L BOD5 gives an incoming load of 200 kg BOD5/day. An aeration volume of 1,000 cubic metres with MLVSS at 3,000 mg/L holds 3,000 kg of biomass. F/M is 200 ÷ 3,000, approximately 0.067 kg BOD5/kg MLVSS/day. Adding 10 kg BOD5/day through a nutrient feed raises it to 0.070, an increase of about 5 percent.
Supplementation adds to the food term. That can help a genuinely under-fed plant during shutdowns, seasonal lulls or after wash-out. When F/M is already high, more feed simply adds load. If a low F/M reflects excessive retained sludge, review sludge age and wasting first. There is no universal F/M target for every plant.
Balancing carbon, nitrogen and phosphorus
For conventional aerobic treatment, a BOD5-to-nitrogen-to-phosphorus mass ratio of about 100:5:1 is a starting point for screening nutrient balance. It relates BOD5 to elemental nitrogen and elemental phosphorus. It is not a dosing instruction: actual demand varies with biomass yield, sludge age and nutrient recycling.
In the example above, 200 kg BOD5/day suggests roughly 10 kg N/day and 2 kg P/day. If usable influent nitrogen is 7 kg/day and usable phosphorus is 1.5 kg/day, the indicative shortfalls are 3 kg N/day and 0.5 kg P/day. These illustrative gaps guide assessment, not a product dose.
Total nitrogen and phosphorus results do not necessarily show what bacteria can use. Organic nitrogen needs to break down first, and some phosphorus is chemically bound. A feed containing carbon also raises the BOD side of the relationship. Recalculate demand after supplementation and check effluent against the site's discharge licence.
How nutrient deficiency can contribute to foam
Foam is a symptom, not a diagnosis. Cleaning surfactants, fats and oils, filamentous bacteria, extracellular polymer and aeration can all contribute. Short-lived white foam after a detergent discharge differs from persistent brown foam.
When nitrogen or phosphorus is limiting, bacteria can produce excess extracellular polymer, a sticky material that traps air, stabilises foam and disrupts settling. Low dissolved oxygen, unsuitable F/M, septicity, grease and pH swings can produce similar symptoms. Microscopy and oxygen uptake testing help distinguish the causes.
Foam and Nutrient Management is not a chemical defoamer and does not knock down foam on contact. It supports nutritional balance where deficiency is contributing. Protein-based feeds can themselves stabilise foam at high concentrations, so trial the intended dose in representative mixed liquor before scaling up.
Odour control through biological stability
Aerobic plants can develop odour when oxygen supply falls behind demand or stagnant solids become septic. Hydrogen sulphide, volatile sulphur compounds and other anaerobic decomposition products may result.
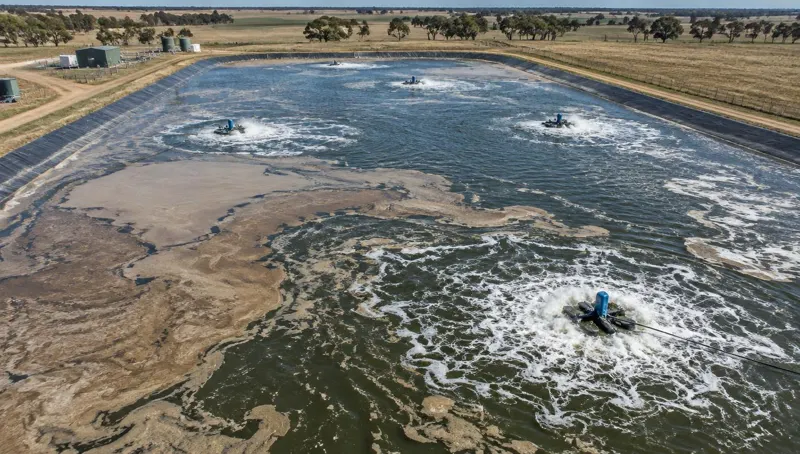
Nutrient support helps only when a confirmed deficiency is limiting treatment and oxygen and mixing are adequate. Carbon-containing feed creates its own oxygen demand. Adding it to an oxygen-limited lagoon or basin can accelerate oxygen depletion and worsen septic conditions.
Check actual oxygen transfer capacity against worst-case load rather than relying on a single midday dissolved oxygen reading. Assess odour at its source using sulphide or hydrogen sulphide measurements, operating records and weather conditions. Upstream pits, accumulated sludge and sludge handling may be the source; nutrient feed in the main reactor cannot fix every odour problem.
Supporting recovery in an underperforming system
Recovery starts by identifying the constraint. Review production changes, hydraulic and organic loading, cleaning chemical carryover, salinity, pH, aeration, sludge inventory and solids separation. Nutrient support cannot compensate for ongoing toxicity, hydraulic wash-out or undersized equipment.
Compare untreated mixed liquor with several proposed doses in a bench treatability trial under equivalent temperature, mixing and aeration. Include a product-only blank so respiration of the added feed is not mistaken for better wastewater treatment. Increased oxygen uptake alone shows bacteria are consuming something, not necessarily that treatment has improved.
Start a controlled plant trial only after a favourable bench response and confirmation of aeration headroom. Agree the dosing point, schedule, observation period and criteria for reducing or stopping feed beforehand. A badly disturbed system may need weeks to rebuild; no fixed recovery time applies to every plant.
- Measure oxygen uptake and soluble COD alongside ammonia and available phosphorus.
- Observe settling, microscopy and foam response consistently.
- Record aeration, wasting and chemical changes that could affect results.
Why higher dosing needs process control
A higher temporary dose is justified only when testing shows a larger nutritional shortfall and the plant can absorb the added load. It is not insurance against a system crash, lagoon turnover or an odour complaint. Lagoon turnover is driven by thermal stratification and mixing, and nutrient feed does not prevent it.
For a flow-based feed, product in kg/day equals dose in mg/L multiplied by flow in cubic metres per day, divided by 1,000. An illustrative dose of 10 mg/L at 500 cubic metres per day is 5 kg/day, not a recommendation. Convert mass to litres using product density before setting a pump. A volumetric dose in mL per cubic metre is not interchangeable with mg/L.
A one-off basin-inventory dose differs from a continuous flow-based feed. Every instruction should specify both concentration and time basis, with an operator read-back to prevent confusion and overdosing.
Measuring whether the program is working
Track influent and effluent organic load, effluent solids, ammonia, phosphorus, dissolved oxygen profiles, pH, sludge inventory and settling. Combine these with microscopy, oxygen uptake and consistent foam observations. Compare similar production periods and document changes that might explain the response.
Account for product use, extra aeration energy and sludge handling costs. A cleaner basin surface is useful evidence, but sustained treatment quality and stable operating costs provide a stronger basis for continuing the program.
Where Foam and Nutrient Management fits
This is a nutritional support tool within a measured biological treatment program. Its role is to address verified nutritional constraints and support viable biomass through shutdowns, seasonal changes and process upsets. Outcomes depend on site conditions and should be measured against a baseline, not assumed.
If your plant is foaming, producing odour or struggling after an upset, share your system type, flows, nutrient results, oxygen records and recent operating changes with Aquativ. We can help assess whether nutrition is the constraint and develop a site-specific trial and dosing program.

Related Aquativ solutions
Explore the programs behind the field notes above.
Product range
Biological programs for home, commercial and industrial systems.
ExploreAll wastewater sectors
Eight sectors, from septic to abattoir and municipal plants.
ExploreIn-situ desludging
Microbial plug programs for aerobic and anaerobic lagoons.
ExploreGrease trap treatment
Biological FOG control for kitchens and food venues.
Explore